The Inquisitor
As the flu season winds down, a team of innovative disease detectives at Boston Children’s Hospital has been tracking its spread…in real time.
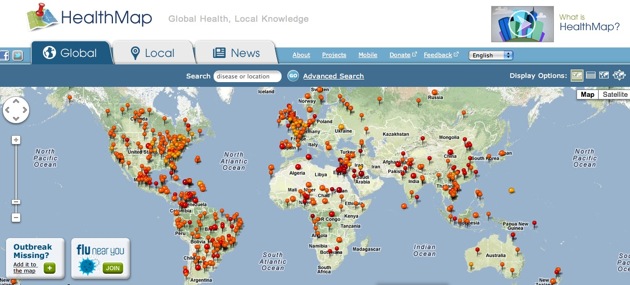
The HealthMap project uses sophisticated software to scour the Internet for information about outbreaks all over the world and to share that data with the public faster than ever before.
By surveilling millions of tweets, Facebook posts, blogs, and news aggregators, HealthMap collects clues about emerging epidemics and displays the results on free Web maps and even a mobile app (Outbreaks Near Me)—which means travelers, public health systems, and governments can respond more quickly to disease threats. And HealthMap’s software is so smart, it even knows the difference between “Bieber fever” and the standard flu symptom.
HealthMap investigators Anna Tomasulo and Dr. John Brownstein answered a few questions about how they mine mountains of Internet noise for useful information about epidemics—from cholera in Haiti to the flu in our own backyards.
What is a “participatory epidemiologist,” and how does he/she investigate infectious diseases?
There isn’t really a standard definition for the field of “participatory epidemiology” or the profession of a “participatory epidemiologist,” but, essentially, the field is about involving communities in defining problems and submitting data. The Internet has really changed everything. Our society expects to access knowledge faster, and to be involved in more processes.
At HealthMap, participatory epidemiologists work to provide data on infectious disease outbreaks faster, and through the use of formal, informal, and user-submitted sources. We investigate outbreaks by using online media (local news sites, mailing lists, blogs, Twitter, etc.) to look for signals or reports of outbreaks.
How was the HealthMap idea born?
HealthMap was founded in 2006 by John Brownstein, PhD, and Clark Freifeld, MS, as a research group in the Informatics Program at Boston Children’s Hospital. To put it simply, they realized that with the information available through the Internet, we should really be learning about infectious disease outbreaks much sooner than we were.
Traditional public health reporting is burdened by structural hierarchies and geo-political problems, which can make reporting time-consuming. As a complement to traditional public health reporting, wouldn’t it be great if we could create an automated system that shows us what online media is saying about infectious disease all around the world in near real-time?
How does HealthMap work?
HealthMap uses scraping, text mining, and natural language processing to bring together disparate online data sources for infectious disease news in fifteen different languages.
The system works in four steps: data acquisition, data characterization, filtering, and clustering. First, HealthMap acquires data through news aggregators (Google News, Yahoo, Baidu, etc.), specific RSS feeds, custom-parsed HTML scraping, and user-submitted reports. Second, the data is “characterized,” or given an appropriate location and pathogen.
So, for example, when ABC News reports that whooping cough cases have reached epidemic levels in the state of California, Google News picks it up. Our system “acquires” it, and “characterizes it by labeling it with “whooping cough” and “California.”
Next, the system filters alerts into the categories of “breaking,” “context,” “old news,” “warning,” or “non-disease related.” The HealthMap system has gone through training in different languages to be able to do this. Last, the system “clusters” alerts that refer to the same outbreaks together.
It’s not too different from what detectives (on TV, at least) do. We gather all of the disease information we can from the Internet. Then we sort it on the map, by location, and tag it as an outbreak, warning or context. Like detectives, we can now use this data to look for trends or clues of disease dynamics.
Could you describe how the team used data from the Web to track the cholera outbreak in Haiti?
We actually had two projects on Haiti. First, we collaborated with several other organizations to map the cholera outbreak. Mapping and crisis response groups got together and gathered information, from official Twitter feeds (Doctors Without Borders, WHO, etc.) and from user-submitted reports (via HealthMap’s “Outbreaks Near Me” tool), to create a map of cholera cases, health clinics, and clean water facilities.
In 2012, the American Journal of Tropical Medicine and Hygiene published a paper in which HealthMap researchers explored the benefits of using social and news media to track disease dynamics. The lead author, Rumi Chunara, a post-doctoral fellow at HealthMap, looked at the volume of cholera-related reports in HealthMap data and tweets, and government cholera cases reported in the first 100 days of the outbreak.
We found a significant correlation between the official data and informal data, but the informal data was available up to two weeks earlier. We concluded that, as a complement to official data, informal data could indeed be used to determine disease dynamics in an outbreak setting.
How does the system distinguish between real information about disease outbreaks and fear-based responses/overreactions?
So, as you’ve identified, one of the challenges with this type of surveillance is that there is a lot of “noise,” somewhat analogous to false leads. This is precisely why participatory epidemiology and informal surveillance is offered as a complement to traditional public health reporting.
Our system has been trained, through a process called Bayesian filtering, to determine what is a “breaking alert.” We also have human curators who go through different language feeds and check that everything is being mapped and characterized correctly. Because we have the alert’s original source, curators can read the source and make sure that “Bieber Fever” is not being labeled as “fever” in “United States.”
How does the medical community and the public at large use the information that you compile?
The main use for our data is an early signal of disease outbreaks. People need this data to prepare for better responses. We collaborate with several different organizations to provide mapped outbreak information with the intention of faster detection of disease outbreaks.
We have created a special map for the annual Hajj that has heightened surveillance for countries sending pilgrims. This is hugely important because there are millions of people that travel to Mecca. Wouldn’t it be nice to know what infectious diseases are circulating in given countries and whether there is a chance that these diseases may be transported to Saudi Arabia?
We also collaborate with Wildlife Conversation Society and USAID to track instances of wildlife disease and illegal wildlife trade on our Wildlife Trade map. We are an increasingly mobile and interconnected society and many emergent diseases are zoonotic. Through disease tracking, USAID hopes to predict and prevent emerging infectious disease outbreaks.
Members of the general population might use our map to investigate what diseases, if any, they should be on the lookout for prior to international travel.
We recently launched a project with the Skoll Global Threats Fund and the American Public Health Association called Flu Near You. This tool asks the public to submit symptom data on a weekly basis. We map the symptoms and show the spread of flu through communities. This tool is really aimed at putting the public back into public health. As we further develop the tool, we hope to increase the benefit to the user, by creating personal profiles and a way to track immunization information etc. So, HealthMap is used by the public, the public health community and the medical community.
What’s the future (or potential) of this kind of disease investigation/information gathering?
We hope the future will bring faster disease detection. Last year, we held the first Digital Disease Detection conference and saw projects from all around the world using digital methods to detect emerging disease trends. We are building up networks of professionals for verifying the data, and we see huge potential for engagement with the public.
Do you see yourself as a detective of sorts?
Absolutely. We refer to ourselves as disease detectives all the time. We detect disease trends to alert the public, public health, and medical communities early enough so they can launch an appropriate response.
Anna Tomasulo, MA, MPH, joined the HealthMap team at Boston Children’s Hospital in 2011 as Editor-in-Chief of The Disease Daily and French feed curator. Her interests include French and Francophone literature, the HIV/AIDS epidemic, the intersection of health and human rights, and running. She has experience working on HIV prevention in Zambia and brings a journalistic touch to HealthMap from her work reporting on early marriage in Nepal with the Pulitzer Center on Crisis Reporting.
John Brownstein, PhD, is co-founder of HealthMap. He holds joint appointments in the Boston Children’s Hospital Informatics Program and Division of Emergency Medicine and is an Assistant Professor of Pediatrics at Harvard Medical School. He was trained as an epidemiologist in the Department of Epidemiology and Public Health at Yale University where he received his PhD. Dr. Brownstein works on novel statistical modeling and medical informatics approaches for accelerating the translation of public health surveillance research into practice.